The industry-leading sensor-driven infrastructure intelligence solution
Everything professionals need to responsibly operate critical infrastructure in increasingly challenging conditions


Browser based. Do your best work no matter where

Data acquisition
Connect to any sensor or IoT device, read any data type, monitor, calibrate, and validate incoming raw data. No vendor lock-in.

Visualization and analysis
Make decisions with confidence. Dozens of visualization and analysis tools help you make sense of complex data and help you with problem solving

Reporting, alarms, and collaboration
Keep everyone in the loop with granular access controls, real-time reporting, and custom alarms
01
Data acqusition
-
No Vendor lock-inConnect to any sensor and import data automatically 24/7
-
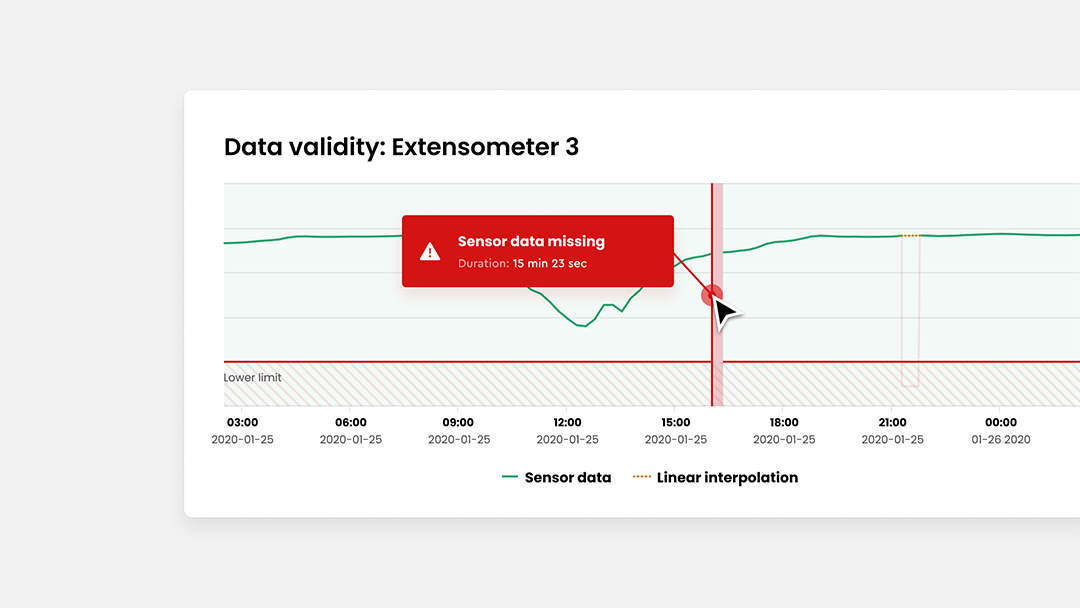
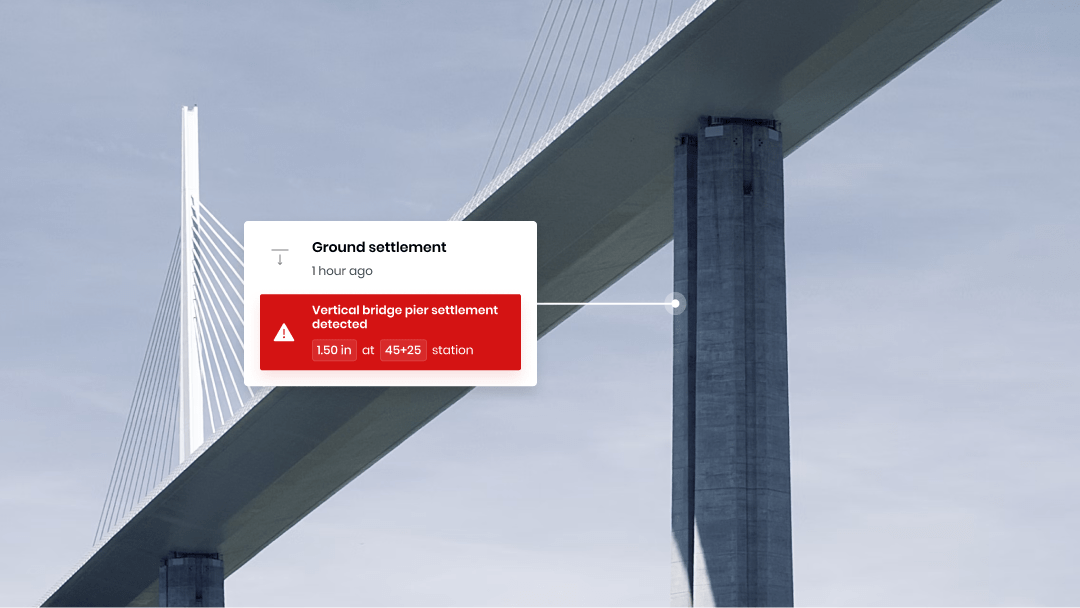
Monitor data qualitySet up alarms for the out-of-tolerance measurements and sensor malfunctions
-
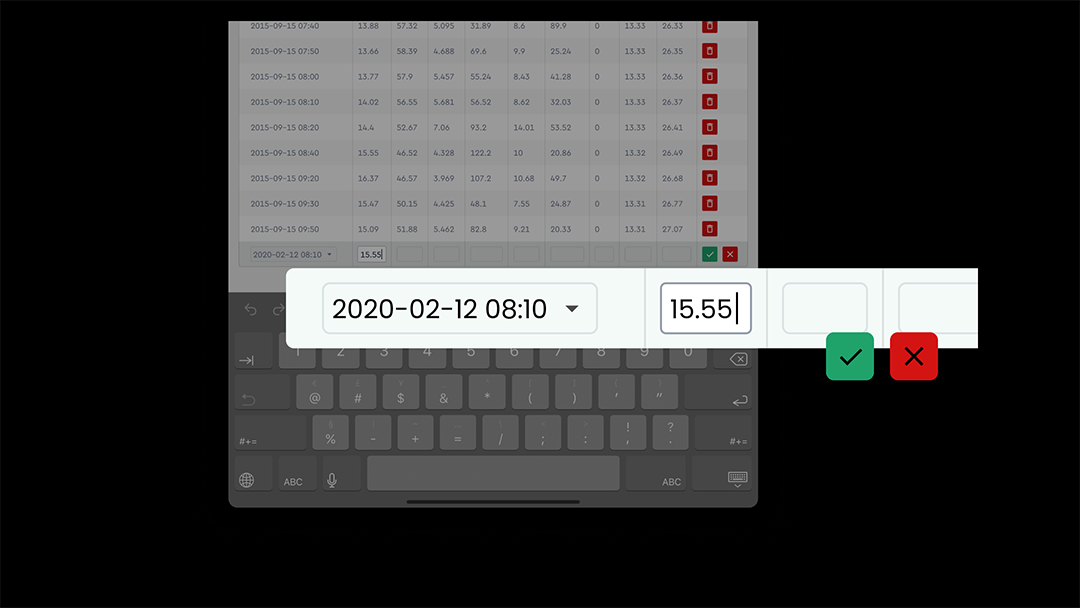
Enter manually collected dataAdd field measurements or manually collected data
No Vendor lock-in
Connect to any sensor and import data automatically 24/7
Monitor data quality
Set up alarms for the out-of-tolerance measurements and sensor malfunctions
Correlate with manually collected data
Add field measurements or manually collected data
Visualization and analysis
-
Make sense of complex dataGet valuable sensor data insights in real-time and make decisions with confidence
-
Show data in contextConnect real-time sensor data with your infrastructure digital twins, engineering cross-sections, or GIS maps
-
Visualizations and analysesOver 30 visualizations and analyses for all project types
Make sense of complex data
Show data in context
Connect real-time sensor data with your infrastructure digital twins, engineering cross-sections, or GIS maps
Visualizations and analyses
Intuitive and actionable visualizations and analyses for any project and any industry

Digital Twins
Create evergreen digital twins in a powerful 4D working environment

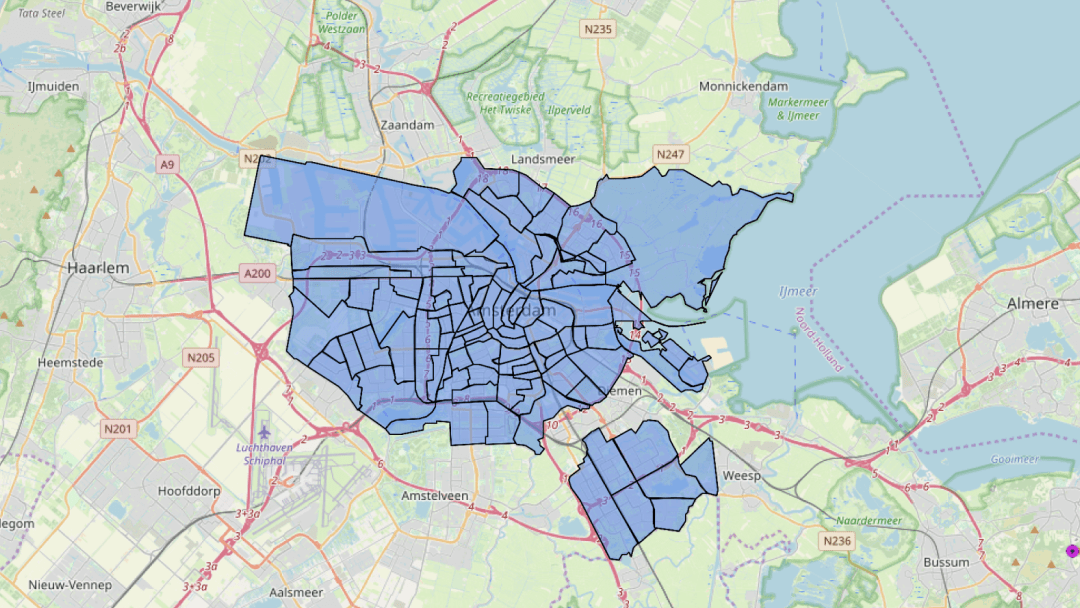
GIS
Create maps with sensor data markers

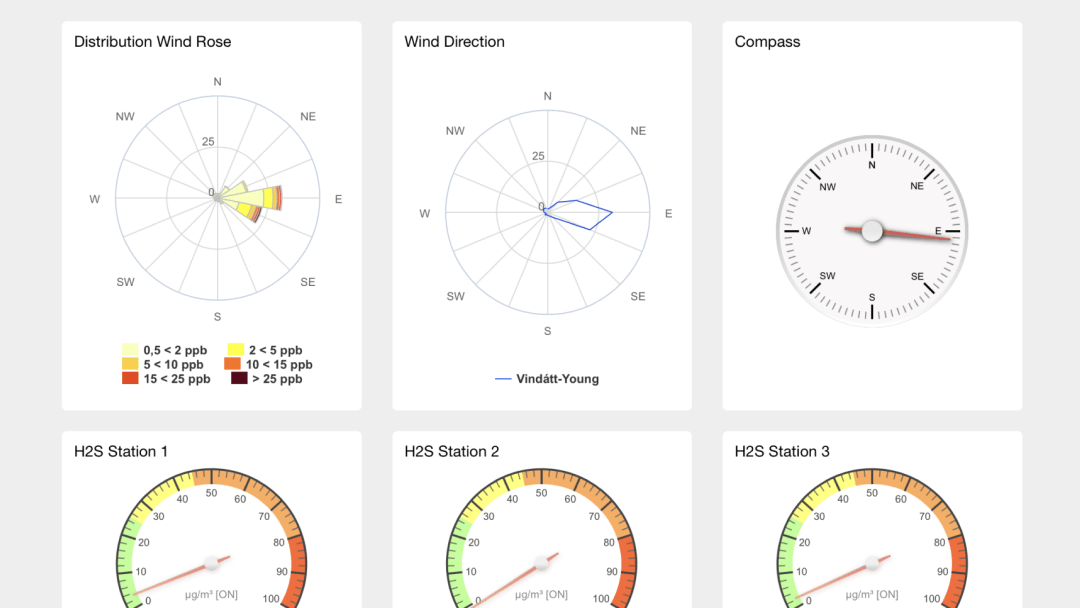
Dashboards
Show the most important insights on custom dashboards

Real-time displays
Show real-time data overlaid over an image

Trend lines
Plot trends and all historical data

Wind roses
Plot multiple types of wind roses

High-speed sensor data
Start plotting high-speed sensor data like vibration and noise in minutes

XY Plots
Show results from SAA sensors and displacement graphs

Tables
Show the numerical data in versatile table views
Reporting, alarms, and collaboration
-
ReportsCreate, design, and schedule the reports for your stakeholders on a daily, weekly or monthly basis
-
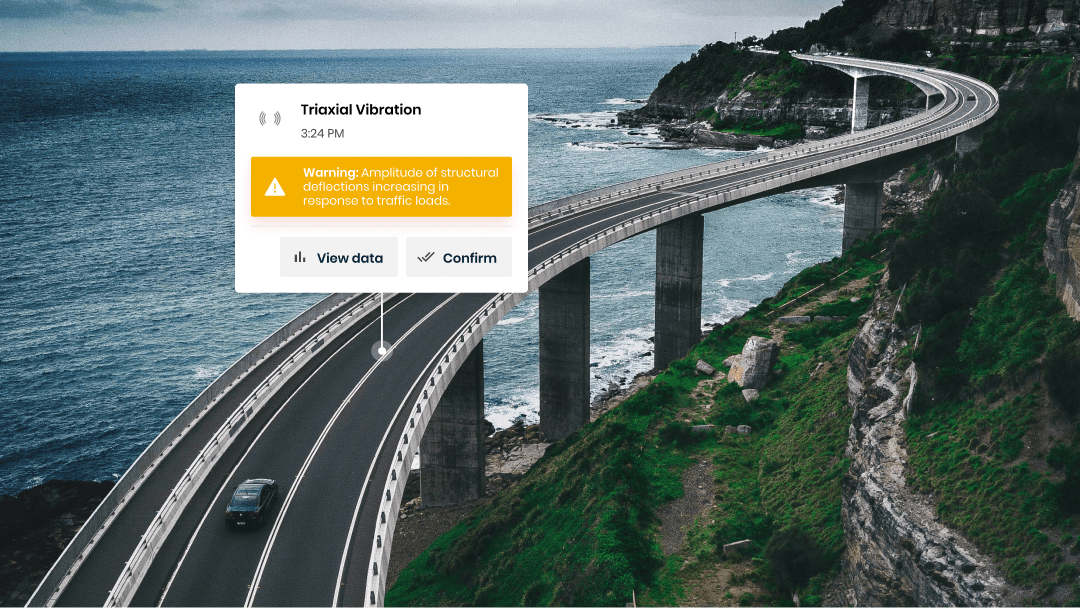
AlarmsRelax and get notified if any values are outside limits or a data import fails
-
CollaborationManage access for all stakeholders. Grant access to features and data with fine-grained user roles
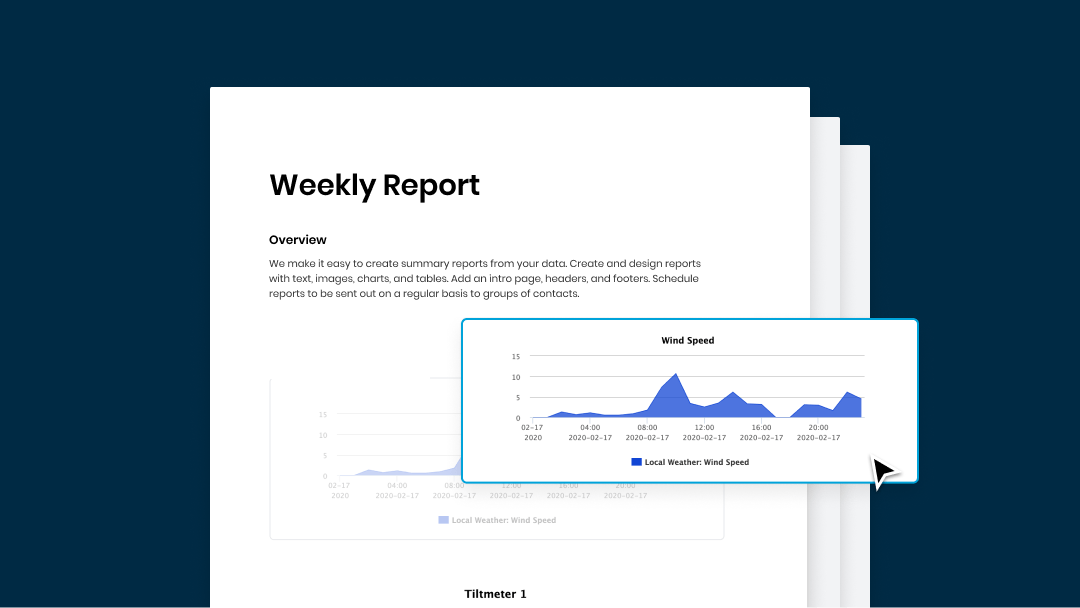
Reports
Create, design, and schedule the reports for your stakeholders on a daily, weekly or monthly basis
Alarms
Relax and get notified if any values are outside limits or a data import fails
Collaboration
Manage access for all stakeholders. Grant access to features and data with fine-grained user roles
Get started. Our team of experts is here to help you.
Expert consultancy
Pilots or large projects
Worldwide support

Alan Jones
Senior Director, BD

Alex Pienaar
Senior Director, Sales